

Зміст
In Google Analytics 4, user engagement is the amount of time someone spends with your web page in focus or your app screen in the foreground. It is not the time a tab sits open, and it is not a count of clicks. It is a measure of active attention, and it feeds several other GA4 numbers, including engaged sessions, engagement rate and average engagement time.
This guide explains what the metric means, how GA4 collects it, what makes a session “engaged,” where to find the numbers and how to read them. We also show how creators can apply the same thinking to their own audiences.
TL;DR
- User engagement in GA4 is the time a page is in focus (or an app screen is in the foreground), according to Google’s own definition.
- GA4 sends that time as
engagement_time_msecin milliseconds, attached to the next event it collects. - A session is engaged if it lasts longer than 10 seconds, has a key event, or has at least two page or screen views. Only one condition is needed.
- Bounce rate is simply the share of sessions that were not engaged, so it is the inverse of engagement rate.
- Engagement time is not session duration: one tracks attention, the other tracks presence.
Зміст
- The short definition, and what it really means
- How GA4 measures engagement time
- What counts as an engaged session
- Engaged users, active users and total users
- User engagement versus session duration
- Where to find engagement metrics in GA4
- How to read the numbers without fooling yourself
- Applying the same thinking to a creator audience
- Our perspective: engagement is only useful when it leads somewhere
- Turning measured attention into earnings
- Practical steps to improve engagement in GA4 terms
- Common mistakes when reading engagement data
- ПОШИРЕНІ ЗАПИТАННЯ
- Sources
The short definition, and what it really means
Google describes user engagement as the time someone spends with your page in focus or your app screen in the foreground. The purpose is to measure when people are actually using your site or app, rather than just having it loaded.
Three practical consequences follow:
- Background tabs do not count. If a visitor opens your page and switches to email, the clock stops.
- It is time-based, not action-based. Scrolling, clicking and reading all add engagement time only while the page is the active one.
- It is collected automatically. You do not need custom code to get it.
People often use “engagement” loosely to mean likes, comments or shares. In GA4 the word has a narrower, more technical meaning. Interactions you define yourself are tracked as events and key events. Engagement is the attention measure that sits underneath them.
How GA4 measures engagement time
GA4 records engagement time in milliseconds and sends it in a parameter called engagement_time_msec. According to Google Analytics Help, that value is added to the next event the property collects, and the parameter is left out if no engagement time has passed since the previous event.
In practice, this means engagement time rides along with whatever happens next: a scroll, a click, a page view on the following page. You rarely see it as a standalone number in a raw event.
The user_engagement event
There is also an event named user_engagement. Google explains that it summarizes the remaining engagement time before the next page loads or when the user leaves. It is listed among the automatically collected events, so it requires no manual setup. It cannot be marked as a key event, which is worth remembering if you are looking for it in your conversion settings.
A simple way to picture it: engagement time accumulates while the page is in focus. When something is about to interrupt that, such as a navigation or the user leaving, GA4 sends whatever time has not yet been reported.
Page views versus engagement
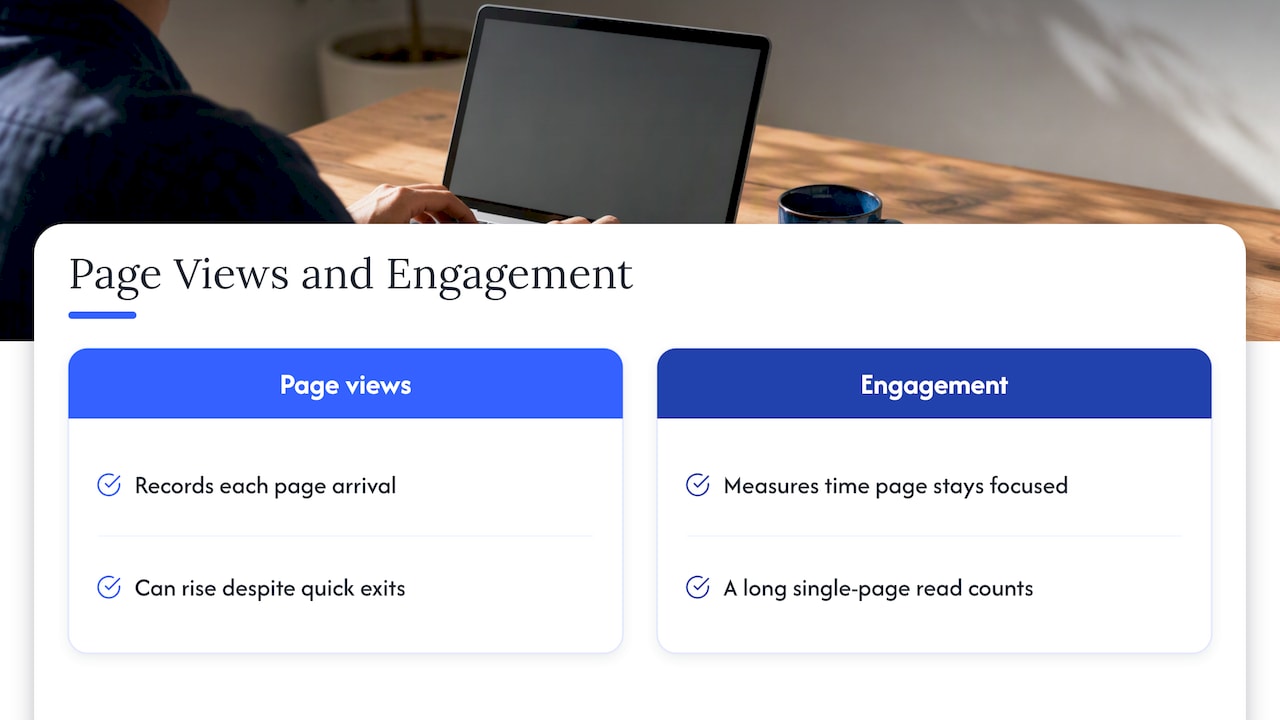
A page_view event is recorded when a user lands on a page. It says that the page loaded. User engagement says how long the person then spent with it in focus. A page can have a large number of views and very little engagement, for example when visitors arrive from a misleading link and leave within seconds. The two metrics answer different questions: how many arrivals, and how much attention.
What counts as an engaged session
A session is the unit GA4 uses to group a visit. By Google’s session documentation, a session starts when a user opens an app in the foreground, or views a page or screen while no session is active.
That same documentation says a session is engaged if it meets at least one of these conditions:
- It lasts longer than 10 seconds.
- It contains a key event.
- It has two or more page views or screen views.
Only one is required. A visitor who reads a single article for three minutes is engaged because of the time. A visitor who spends four seconds on a page but completes a key event is engaged because of the event. A visitor who looks at two pages for three seconds each is engaged because of the page count.
One detail often missed: first_visit, first_open and session_start are excluded from engaged-session calculations, even if you have marked them as key events. A new visitor therefore does not become “engaged” merely by arriving.
Engagement rate and bounce rate
GA4 defines engagement rate as engaged sessions divided by total sessions. Bounce rate is the percentage of sessions that were not engaged. The two always add up to 100%, as Google explains.
Here is a worked example with made-up numbers:
| Metric | Value |
|---|---|
| Sessions | 1,000 |
| Engaged sessions | 620 |
| Engagement rate | 62% |
| Bounce rate | 38% |
A visit under 10 seconds with no key event and no second page or screen view is not engaged. If that was the user’s only session, it counts toward a 100% bounce rate for that visit and a 0% engagement rate.
This differs from the older bounce rate many marketers remember, which only looked at single-page visits. In GA4 a long single-page read counts as engaged, so a blog post that people finish reading no longer looks like a failure.
Engaged users, active users and total users
Engagement also shapes how GA4 counts people. Google defines active users as people who engaged with your site or app during the date range, while total users are unique users who triggered any event.
For websites, a user is counted as active when GA4 detects an engaged session, the first_visit event, or engagement_time_msec. App conditions vary by platform and include first_open, user_engagement або engagement_time_msec.
This is why “Users” in standard reports usually means active users. If your total users number looks higher than your active users, the gap is people who triggered an event but never engaged.
User engagement versus session duration
Readers often ask how engagement differs from session duration. Universal Analytics trained many of us to look at session duration, and GA4 moved away from it.
The simplest distinction is presence versus attention. Session duration covers the span of a visit, including idle moments. Engagement time counts only the time the page was in focus. One GA4 explainer puts it that session duration includes idle time, while engagement time reflects active interaction. As a result, average engagement time is usually lower than the old session duration figures, and that is expected rather than a sign that something broke.
GA4 reports two versions of the engagement figure:
- Average engagement time per active user: total user engagement divided by active users.
- Average engagement time per session: total user engagement divided by sessions.
Use the per-user version to judge how much attention each person gives you across visits. Use the per-session version to compare traffic sources or landing pages.
Where to find engagement metrics in GA4
Google states that engagement metrics appear by default in the Pages and screens report and the Events report. You can also customize a report or build an Exploration to include them.
Engagement rate and bounce rate are different: they are not included in most GA4 reports by default. An Editor or Administrator can add them to detail reports through Reports, Customize report, Report data and Metrics.
A quick routine:
- Open Reports and go to Залучення, then Pages and screens.
- Review average engagement time and views by page.
- In Acquisition, open the traffic acquisition report and customize it to add engagement rate.
- Compare channels: a source with many sessions and a low engagement rate is sending the wrong visitors, or the landing page is not matching the promise.
How to read the numbers without fooling yourself
Raw engagement numbers mean little without context. A few habits help:
- Compare like with like. A product page and a long guide will never share the same engagement time. Compare a page to its own history or to similar pages.
- Segment by source. An email list and a cold social post will behave differently.
- Pair time with outcomes. High engagement time with no key events can mean content people enjoy but are not acting on. Low time with strong key events can simply mean a fast, clear page.
- Check your key events. Because a key event makes a session engaged on its own, loosely defined key events can inflate your engagement rate.
- Look at trends. A sudden change after a site update often points to a tagging problem rather than a change in audience behavior.
Applying the same thinking to a creator audience
GA4 measures a website. Creators also have an audience that behaves in similar ways: fans arrive, some stay, some subscribe, and some come back. The logic of engagement carries over, even when the dashboard is different.
If you promote your profile through a link in bio, a landing page or a blog, GA4 can tell you which of those visits were real attention and which were bounces. Pair that with the metrics inside your creator platform, such as subscriptions, tips, messages and live stream attendance, and you can see the whole path from first click to paying fan.
Our own guides go deeper on this side of the topic: a complete guide to user engagement on creator platforms, an explanation of the role of engagement metrics for creators, and a look at analytics for adult streaming creators. If your goal is to raise engagement rather than only measure it, see how interactive features boost engagement and earnings.
Our perspective: engagement is only useful when it leads somewhere
We work with independent creators, and the pattern we see in the creator economy is consistent: attention matters, but only when it connects to a way of earning. A visitor who spends two minutes on a page and leaves has given you engagement time and nothing else. A fan who subscribes, sends a tip or joins a live stream has given you a relationship.
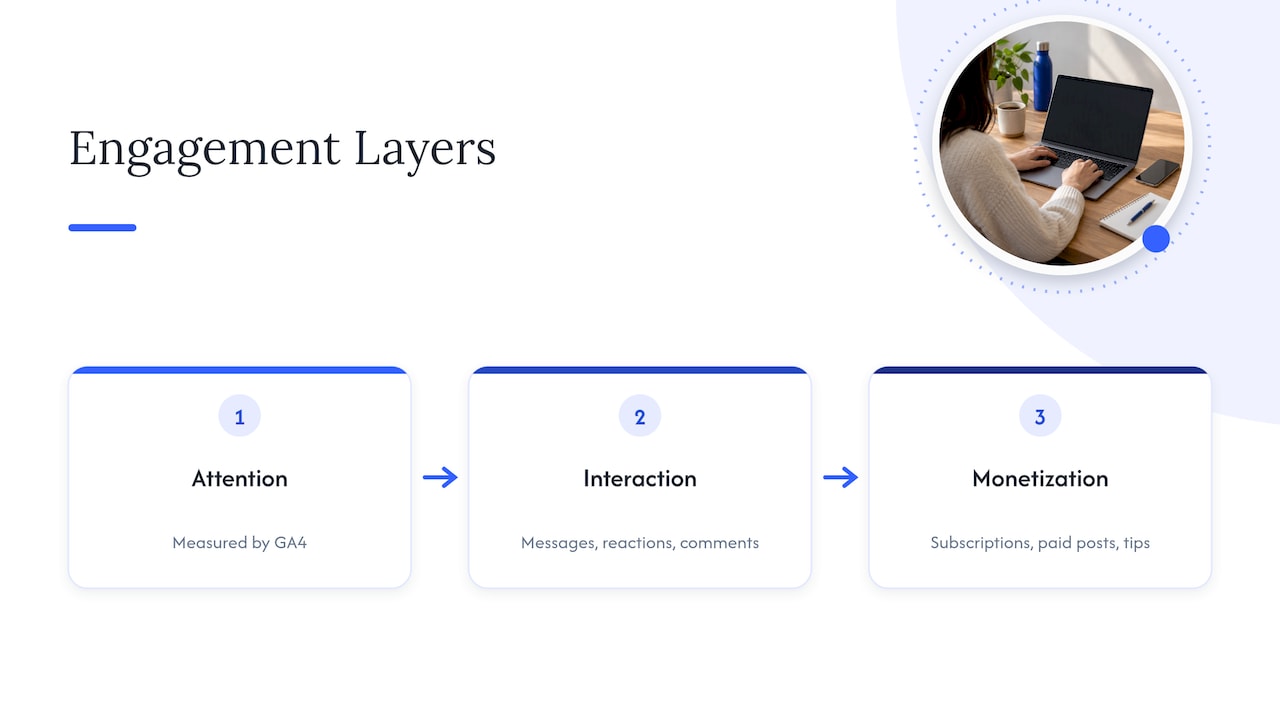
That is why we think of engagement in layers. The first layer is attention, which is what GA4 measures. The second is interaction: messages, reactions, comments. The third is monetization: subscriptions, paid posts, bundles and tips. Strong creators watch all three and ask where fans drop out between them.
Our approach to the platform follows from this. Creators do not pay fees to join or use Fanspicy, and they keep control of the audience they build. Earnings come from several formats, so a creator is not forced to rely on one type of content. A fan who is not ready to subscribe can still tip, join a live stream or buy a single piece of content, which gives creators more ways to turn attention into income.
If you are testing the waters with analytics, start small. Pick one landing page, track one key event, and watch engagement rate for a month. Clear, simple measurement beats a dashboard full of numbers nobody acts on.
— fan
Turning measured attention into earnings
If you already know where your visitors come from and which pages hold their attention, the next step is giving them somewhere to go. Fanspicy is a paid social media and live cam platform where independent creators sell subscriptions, exclusive content, private messages and live streams, and receive tips from fans. You can move content over from other platforms and keep your audience relationships in your own hands.
Ready to put your traffic to work? Create your creator profile to start with exclusive content, tips and paid posts, or see how subscriptions, private messages and live streams work for fans.
Practical steps to improve engagement in GA4 terms
Once you can read the numbers, these actions tend to move them:
- Match the page to the promise. If a link says one thing and the page opens with another, expect a high bounce rate.
- Put the value early. Visitors decide in seconds. Anything that keeps them past 10 seconds, or leads them to a second page, makes the session engaged.
- Link to a logical next page. A second page view is enough to count the session as engaged, and good internal links serve readers as well.
- Make the main action obvious. Define a clear key event, such as a sign-up or a click to your profile, and make it easy to reach.
- Improve load speed and mobile layout. Slow pages lose people before engagement starts.
- Review monthly. Check engagement rate by channel, drop what is not working and double down on what is.
If live content is part of your strategy, our pieces on live cam content types that boost viewer engagement і live cam engagement ideas that lift subscription rates give concrete ideas. For promotion beyond your own site, adult marketing strategies and tactics cover how to reach new fans.
Common mistakes when reading engagement data
- Treating engagement time as reading time. It measures the page being in focus. A person can leave a page open while they think about something else, so it is an approximation of attention, not proof of it.
- Comparing GA4 to Universal Analytics. The definitions of sessions, bounce rate and time are different, so old benchmarks do not transfer.
- Ignoring the 10-second threshold. Because it is the line between bounce and engaged, a page that holds visitors just beyond it can look healthier than it is. Look at average engagement time alongside the rate.
- Forgetting key event settings. Marking a very common action as a key event makes nearly every session engaged.
- Looking only at totals. Averages hide the difference between a handful of devoted visitors and many casual ones. Segment before concluding.
ПОШИРЕНІ ЗАПИТАННЯ
What counts as user engagement in Google Analytics?
GA4 counts the time a page is in focus or an app screen is in the foreground. Engagement time is sent with events as engagement_time_msec. A session also counts as engaged if it lasts over 10 seconds, has a key event, or has at least two page or screen views.
What does user engagement mean in Google Analytics?
It means active use of your site or app, measured as time with the page or screen in front of the user. It is an attention measure, not a count of likes or clicks. Other GA4 metrics, such as active users and engagement rate, are built on it.
What is the difference between page views and user engagement?
A page view records that a page was loaded. User engagement records how long that page was in focus. You can have many views with little engagement if visitors leave quickly.
What is the difference between user engagement and session duration?
Session duration measures how long a visit lasted, including idle time. Engagement time only counts active, in-focus time, so it is usually lower. GA4 now emphasizes the engagement figures for that reason.
Is bounce rate still in GA4?
Yes, but it is defined differently. It is the percentage of sessions that were not engaged, so it equals 100% minus engagement rate. It is not shown in most reports by default, but an Editor or Administrator can add it.
Sources
- User engagement – Analytics Help
- Automatically collected events – Analytics Help
- Session – Analytics Help
- Engagement rate and bounce rate – Analytics Help
- Understand user metrics – Analytics Help
- GA4: Session Duration vs. Engagement Time Explained